 So maybe you need to draw a pentagon? or a hexagon? How about just a simple equilateral triangle? Any of those seemingly basic primitive regular polygons that you learned about back in geometry class. The Canvas API is extremely powerful and enables you to draw just about anything with Javascript. But that doesn’t mean that the Canvas provides a simple API for every shape that you might want to draw. In fact, the Canvas API provides almost no simple shape drawing outside of rectangles. Rather the Canvas API provides a set of very powerful and flexible basic drawing functions based on the path abstraction that can be used to draw just about anything. But in order to wield the Canvas properly, you have to have a good understanding of the APIs and sometimes a tad bit of trigonometry.
In this article, I’m going to show you how to not only draw an arbitrary regular polygon, but we’ll also be delving deeper to understand the algorithm and the math behind the code and hopefully in the process providing a better understanding of how to use the HTML5 Canvas API.
A pentagon, a hexagon, an octogon and even an equilateral triangle are all classified as regular polgons. A regular polygon is a polygon that is both equiangular and equilateral. Meaning that all angles are equal and all sides have the same length. They can be both convex or concave (star-shaped). In this article, we’ll be focusing solely on the convex variety. Drop me a note on Twitter, if you’d like to see an article on star-shaped regular polygons.
In order to understand an algorithm for drawing a regular polygon. Let’s look at the interrelationship of all regular polygons to a circle.
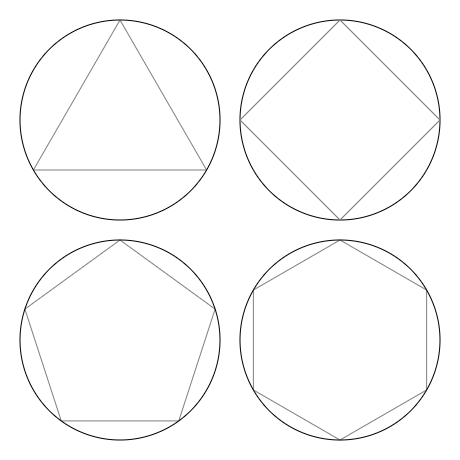
As the diagram illustrates. The vertices for all regular polygons can be inscribed on a circle with the same radius. Therefore if we divide a circle in a number of equal parts and draw lines between those points. The lines will yield a regular polygon. As an example, if we wanted to make a regular polygon with three sides (an equilateral triangle by any other name), we could divide a circle into three parts as the next figure shows.
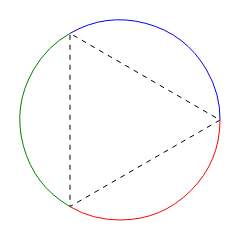
By drawing lines between the segments of the circle we are left with a regular polygon with three sides. The same technique can be scaled up to draw a regular polygon with an arbitrary number of sides. So now that you can visualize the algorithm, lets cover the actual math behind it. We all know that a circle is 360 degree. But the canvas API doesn’t work with angles specified in degrees. The Canvas API as well as the trigonometric functions provided by Javascript such as Math.sin and Math.cos all use radians as the units for specifying angles. A full circle of 360 degrees equates to 2Π (or 2 * Pi) radians. Given that we know how many radians constitutes a circle, we can divide that up by the number of pieces that we’d like to slice our circle up into by using simple division. Given this description, let’s go ahead and show you a Javascript function that can be used to draw an arbitrary regular polygon and I’ll walk you through it.
function polygon(ctx, x, y, radius, sides, startAngle, anticlockwise) {
  if (sides < 3) return;
  var a = (Math.PI * 2)/sides;
  a = anticlockwise?-a:a;
  ctx.save();
  ctx.translate(x,y);
  ctx.rotate(startAngle);
  ctx.moveTo(radius,0);
  for (var i = 1; i < sides; i++) {
    ctx.lineTo(radius*Math.cos(a*i),radius*Math.sin(a*i));
  }
  ctx.closePath();
  ctx.restore();
}
The polygon function shown above, will create a path for any regular polygon with it’s center at the provided (x,y) coordinates. Since a polygon by definition has to have at least three sides. The first line of our function simply returns immediately if less than three sides are specified. In the next line, we divide the angle for an entire circle 2Π (or 2 * Pi) by the number of sides that we’d like to have in our regular polygon. The variable a will contain the angle of the arc that equates to a side of our polygon. The next line in the function will determine whether our polygon is drawn in a clockwise or a anticlockwise direction based on the optional anticlockwise (true or false) parameter. Later I’ll discuss briefly why this may be important . We then push the context’s state on the stack with a call to the save method, so that we can restore it back to the way we received it later. In the next line, we translate the context’s current drawing matrix by calling the translate method. This will allow us to do all of our calculations with respect to the origin since this effectively moves the origin to the coordinates (x,y). The rotate method called in the next line is used to alter the initial angle used to position the first vertex of our polygon. In order for me to explain the next line, let’s look at the trigonometric formulas for the x and y coordinates of a unit circle (circle of radius one).
x = cosine(a)
y = sine(a)
These functions will return the x and y coordinates for points on a unit circle centered on the origin given an angle, a, from 0 to 2Π. The generalized formulas for a circle of an arbitrary radius, r, is as follows:
x = r * cosine(a)
y = r * sine(a)
These formulas give us the power to calculate the x and y coordinate for any point on a circle given the radius, r, of the circle and the angle, a, of the point we want. Returning to the polygon function, the moveTo line could be written as follows:
ctx.moveTo(radius*Math.cos(0),radius*Math.sin(0));
But given an angle of zero and the fact that cosine(0) = 1 and sine(0) = 0 this simplies down to just the following:
ctx.moveTo(radius,0);
This moves the pen location of the current path to the position of our polygon’s first vertex. The next line defines a loop that will add a line for each of the polygon’s sides to the current path. Given the same formula and the angle of each of our vertices (as multiples of the variable a) the following loop will add all but the last line of the polygon to the current path.
for (var i = 1; i < sides; i++) {
 ctx.lineTo(radius*Math.cos(a*i),radius*Math.sin(a*i));
}
The next line contains a call to the closePath method which will close our path, adding the last line of the polygon to our path. We then clean up after ourselves by calling the context’s restore method. This will restore the context’s state back to the way we found it, including the context’s current transformation matrix.
One important thing to note is that this function doesn’t actually draw anything. This function defines a drawing path in the shape of a regular polygon given the parameters provided. Once we have a polygon-shaped path, we can stroke it with the stroke method, or fill it with the fill method or even use it to clip future drawing with the clip method. The following snippet will draw a single stroked pentagon (5-sided regular polygon).
context.beginPath();
polygon(context, 120,120,100,5);
context.stroke()
Which will give us the following shape

You might notice that the pentagon looks like it lying on it’s side. That’s because the first first vertex at angle 0 is located at the (x,y) coordinates of (radius, 0). This is consistent with how angles are specified in the context’s arc and ellipse methods. To get a polygon that is visually “upright”, we can rotate the polygon negative 90 degrees (or -Π/2 radians) as follows:
context.beginPath();
polygon(context, 120,120,100,5,-Math.PI/2);
context.stroke()
Which will give us the following:

The last thing that I wanted to cover is the anticlockwise parameter. This determines whether the lines for the polygon are added in a clockwise or an anticlockwise direction. This can be used in conjunction with the Canvas APIs nonzero winding rule to provide finer control over what pixels lie inside or outside of a more complex overlapping or nested paths. Drop me a note on Twitter, if you’d like to learn more about winding rules and how to use them.
I hope you’ve enjoyed this article and that it gives you more ideas on how you can use the Canvas API. If so there’s more of where that came from… Sign up for my mailing list to find out when my new book “Essential Canvas for HTML5” is available. Just drop your email into the form below so that I can let you know when it’s available.
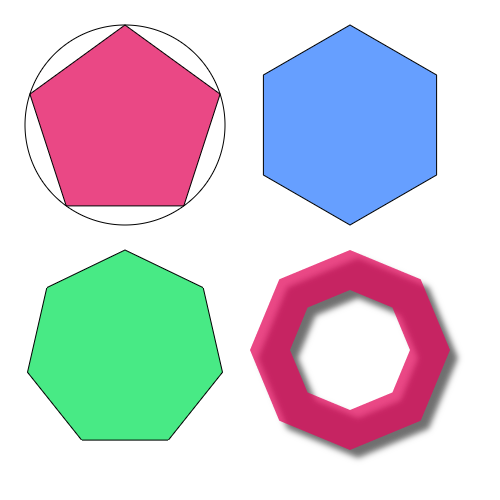
I’ll leave you with one last example:
context.beginPath();
polygon(context,125,125,100,5,-Math.PI/2);
context.fillStyle="rgba(227,11,93,0.75)";
context.fill();
context.stroke();

// Draw a circle to encompass this polygon
context.beginPath();
context.arc(125, 125, 100, 0, Math.PI * 2);
context.stroke();

context.beginPath();
polygon(context,350,125,100,6,-Math.PI/2);
context.fillStyle="rgba(51,128,255,0.75)";
context.fill();
context.stroke();

context.beginPath();
polygon(context,125,350,100,7,-Math.PI/2);
context.fillStyle="rgba(11,227,93,0.75)";
context.fill();
context.stroke();

context.beginPath();
polygon(context,350,350,100,8,0,false);
polygon(context,350,350,60,8,0,true);
context.fillStyle="rgba(227,11,93,0.75)";
context.shadowColor = 'rgba(0,0,0,0.75)';
context.shadowOffsetX = 8;
context.shadowOffsetY = 8;
context.shadowBlur = 10;
context.fill();
I’ll just touch briefly on the last figure which demonstrates a polygon with a nested polygonal hole. This leverages the Canvas’s winding rules for defining what pixels lie inside the path and which lie outside the path (and are not filled) and uses transparency and a drop shadow to add texture and depth.
Great posts guys, nice run through.
Great post John, it told me what I wanted to know in an understandable way. The bit about the interrelationship of polygons to a circle is a very valuable thing to know, so thanks for explaining that 🙂